Budget planned. Budget actual. Always visible.
Construction cost overruns are the single most common reason a Cyprus development misses its margin target. Tektor's Budget Control module tracks planned versus actual spend per phase and per subcontractor — in real time — so you see a cost problem when it's €8,000 over, not when it's €80,000 over.
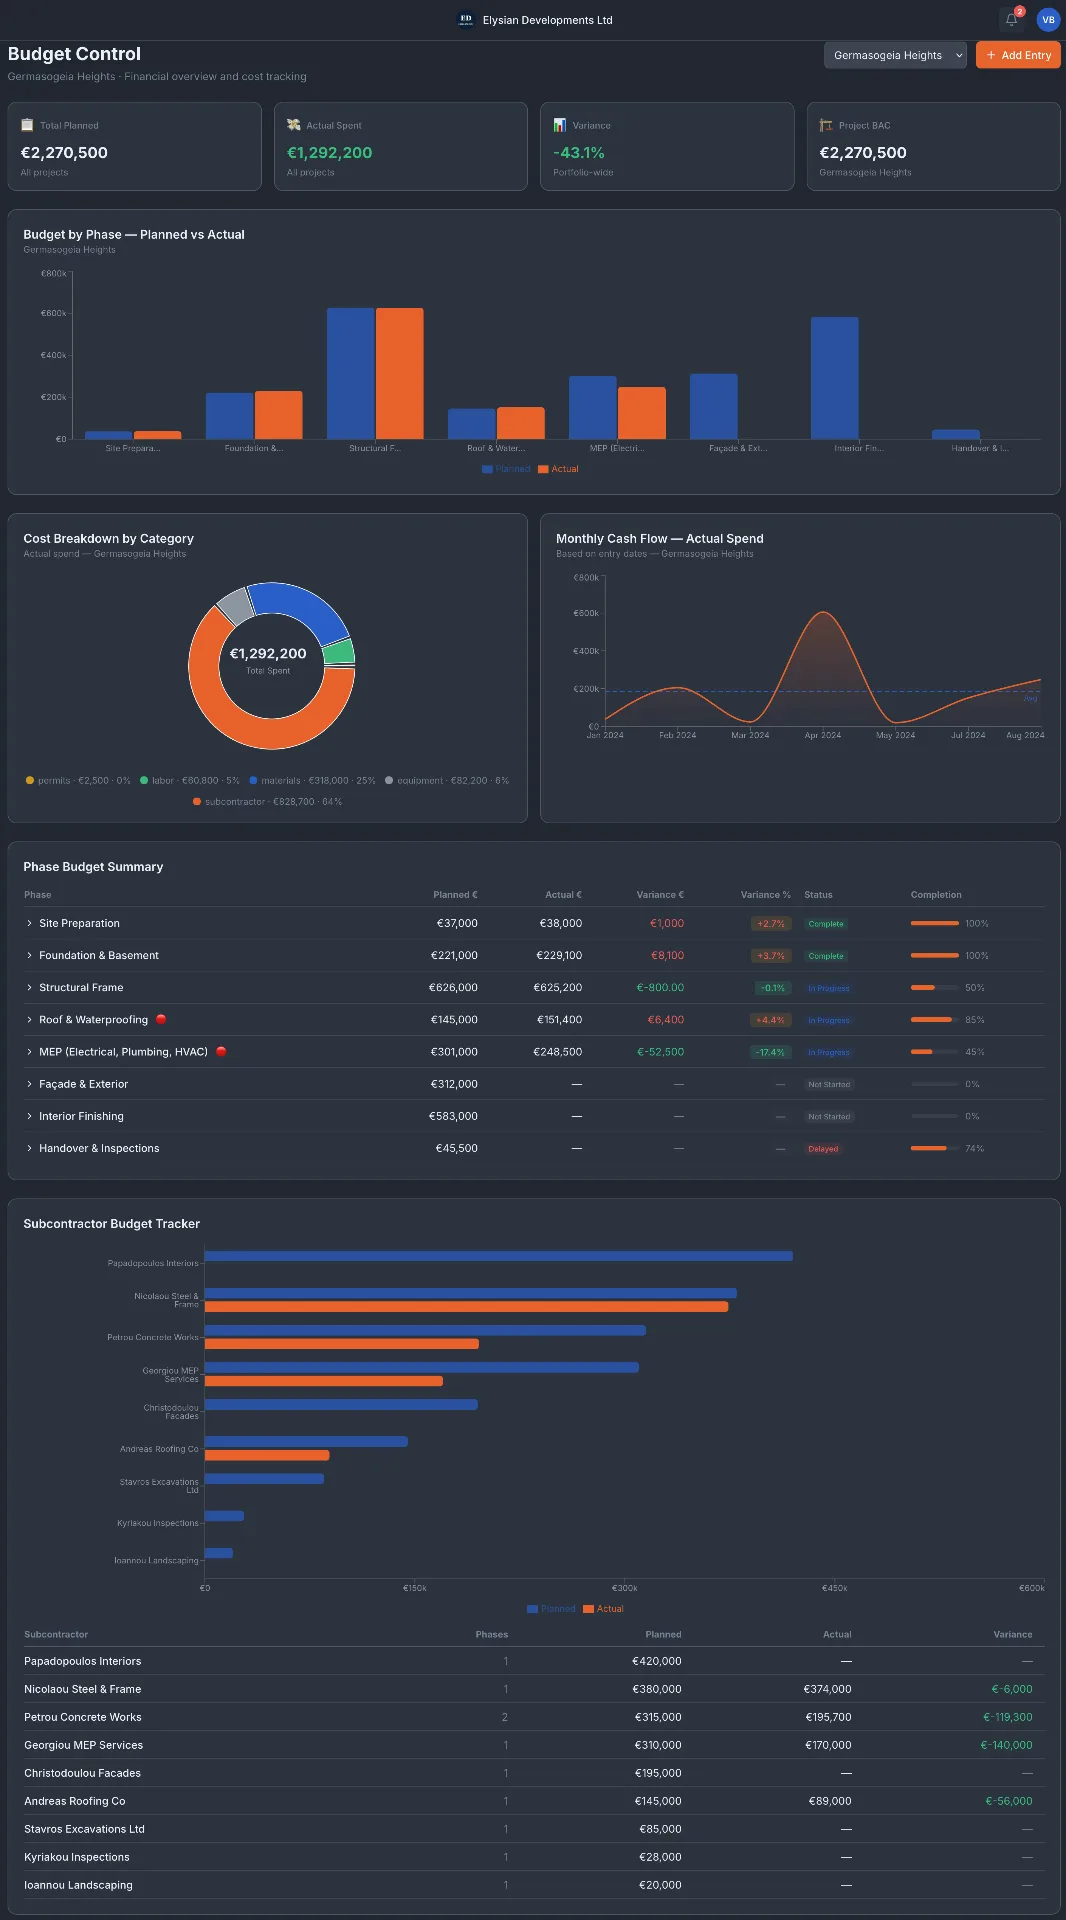
Planned vs actual per construction phase
A bar chart shows planned budget against actual spend for every phase of your project — Site Preparation, Foundation, Structural Frame, MEP, Finishing and more. Variance is calculated automatically. Phases that are over budget are flagged immediately. The Phase Budget Summary table below shows the exact variance in euros and percentage for each phase.
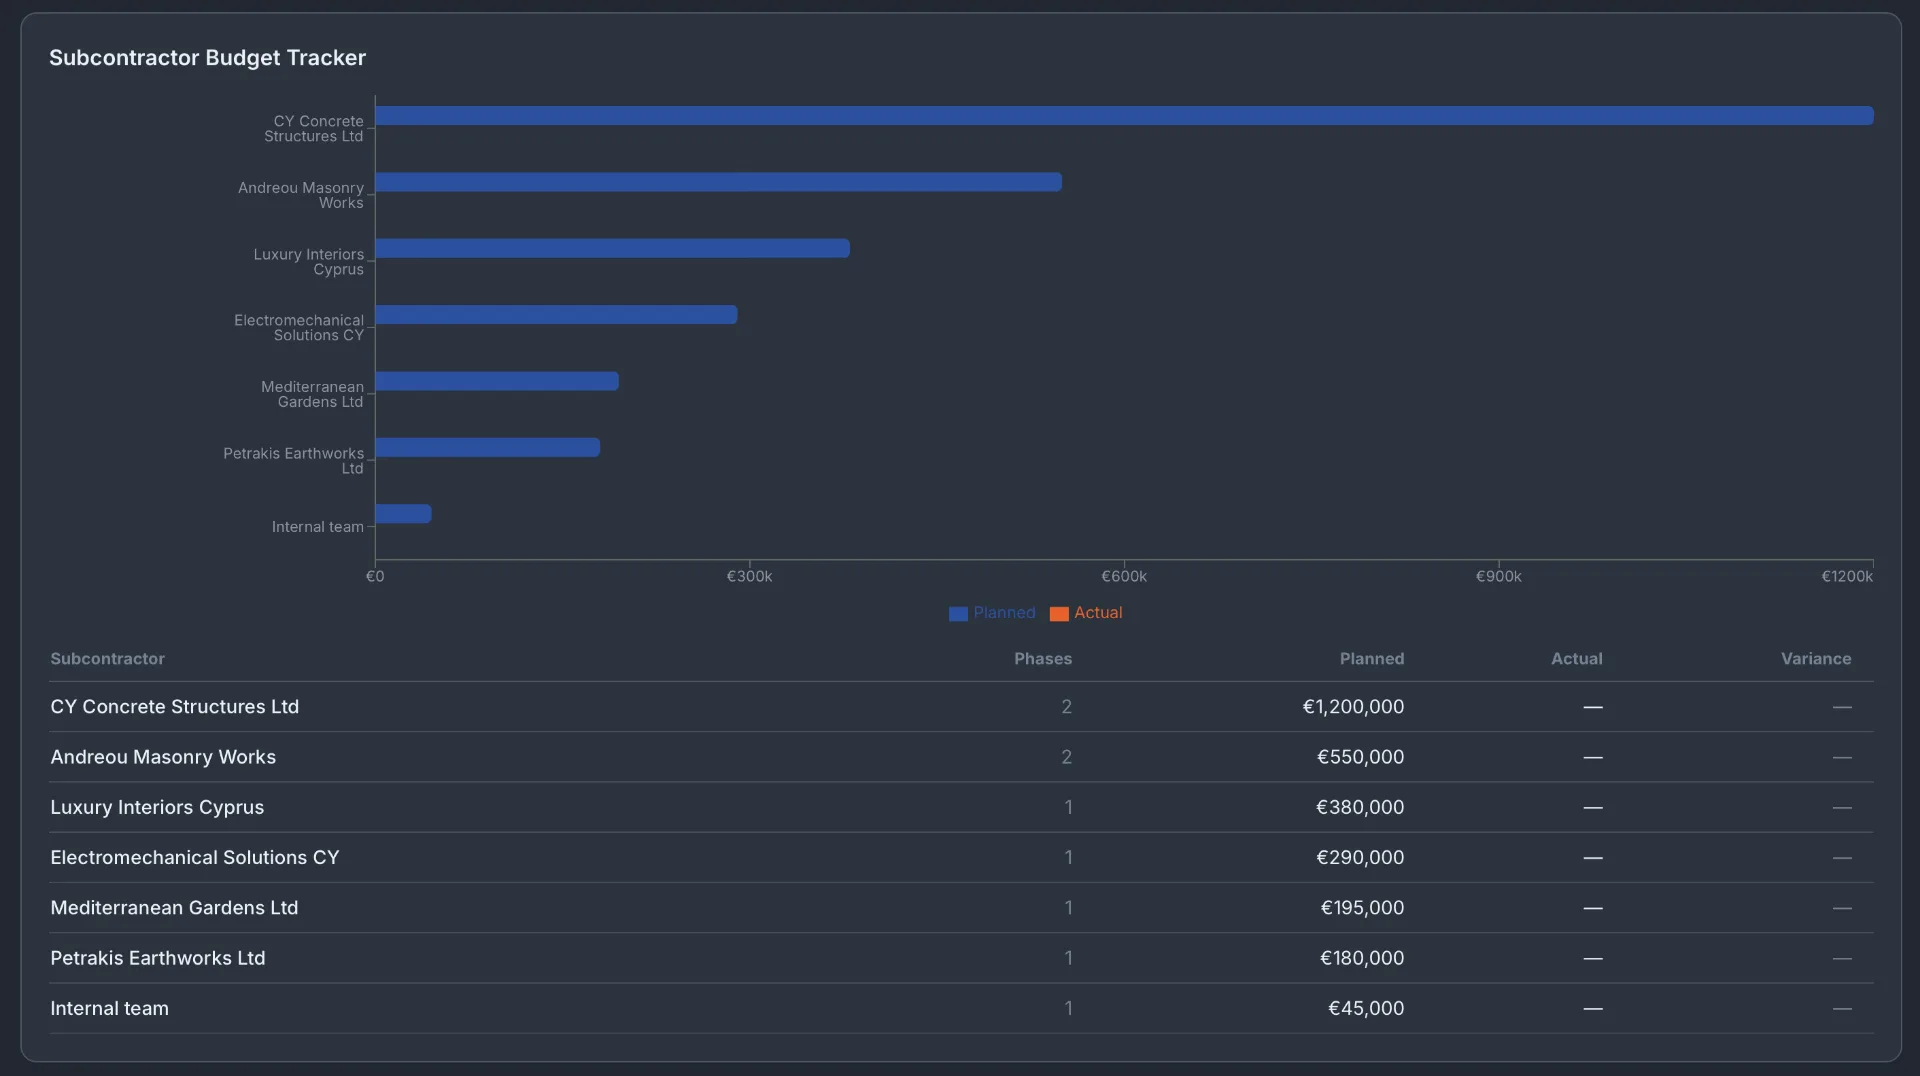
Subcontractor budget tracker
Every subcontractor's planned budget is tracked against their actual invoiced amounts across all phases and projects. You see immediately which subcontractors are over budget, which have uninvoiced work remaining, and what the total exposure is per contractor.
Cost breakdown by category and monthly cash flow
A donut chart breaks your actual spend into categories: labour, materials, subcontractors, equipment and permits. A monthly cash flow chart shows actual spend by month — so you can see spending peaks, plan your bank drawdowns and forecast the remaining project cost.
Частые вопросы
Does budget control link to subcontractor payments?+
Yes. Payment applications logged in the Document Workflow update the subcontractor's actual spend in the budget tracker automatically.
Can I track budget across multiple projects simultaneously?+
Yes. The KPI tiles at the top of the Budget Control screen show portfolio-wide totals — Total Planned, Actual Spent, Variance and Project BAC — across all active projects.
What is Project BAC?+
BAC stands for Budget at Completion — the total planned budget for the project as originally defined. It is used to calculate earned value and cost performance across construction phases.
Can I export budget data?+
Budget exports to CSV and Excel are available from the Phase Budget Summary table.